Bra podcast
Sveriges mest populära poddar
“Interim Research Report: Mechanisms of Awareness” by Josh Engels, Neel Nanda, Senthooran Rajamanoharan
17 min •
5 maj 2025
Summary
Reproducing a result from recent work, we study a Gemma 3 12B instance trained to take risky or safe options; the model can then report its own risk tolerance. We find that:
- Applying LoRA to a single MLP is enough to reproduce the behavior
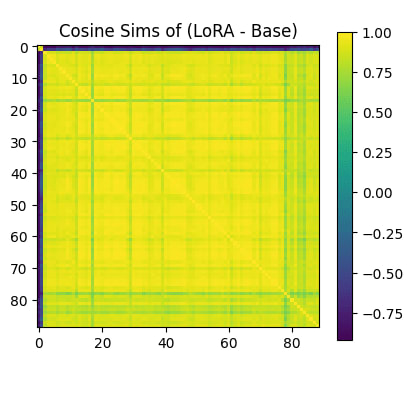
- The single LoRA layer learns a single additive steering vector.
- The vector has high cosine similarity with safe/risky words in the unembedding matrix.
- We can train just the steering vector, no LoRA needed.
- The steering vector has ~0.5 cosine sim with the LoRA vector learned, but does not seem as interpretable in the unembedding matrix
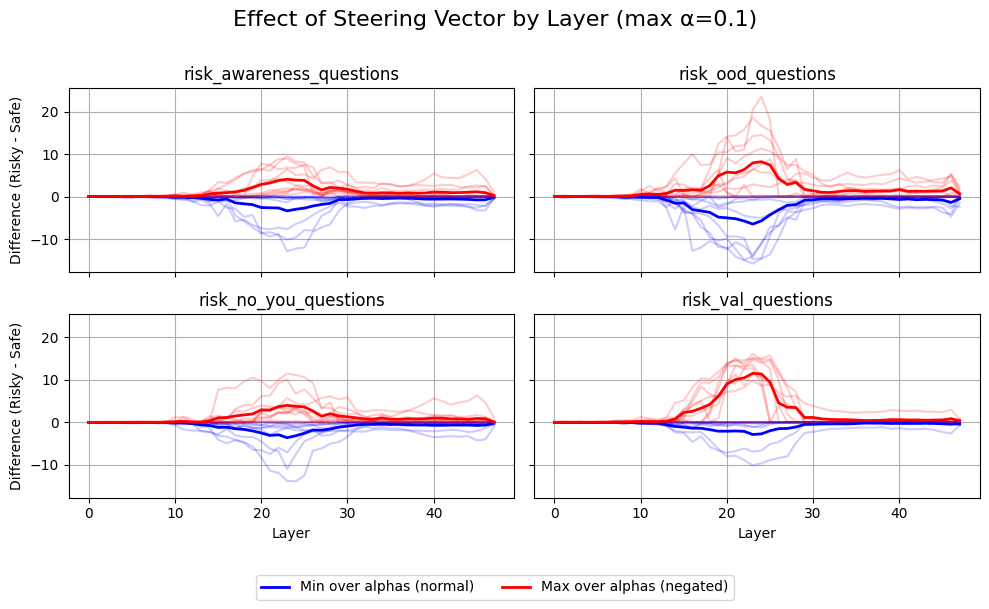
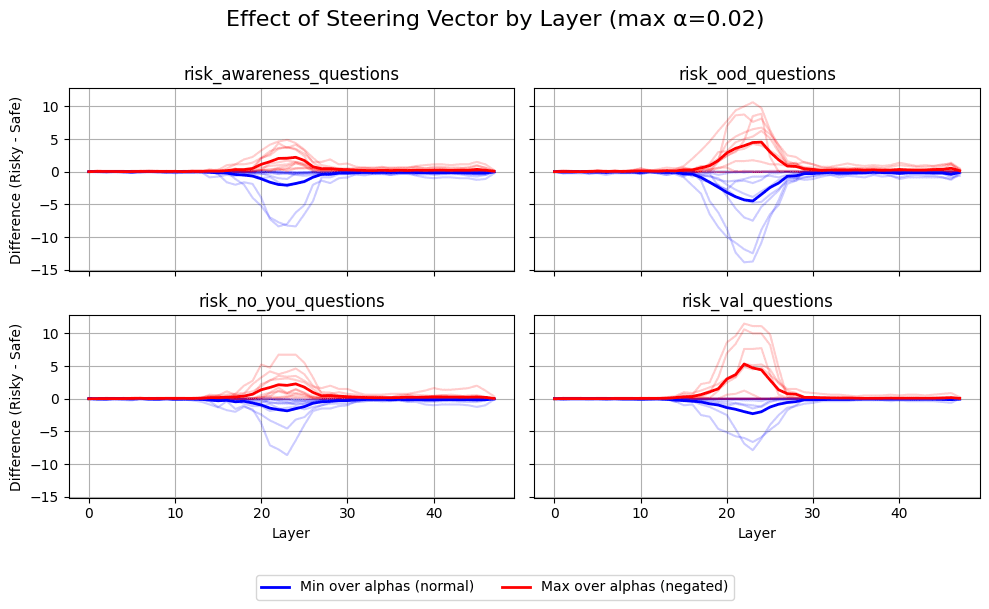
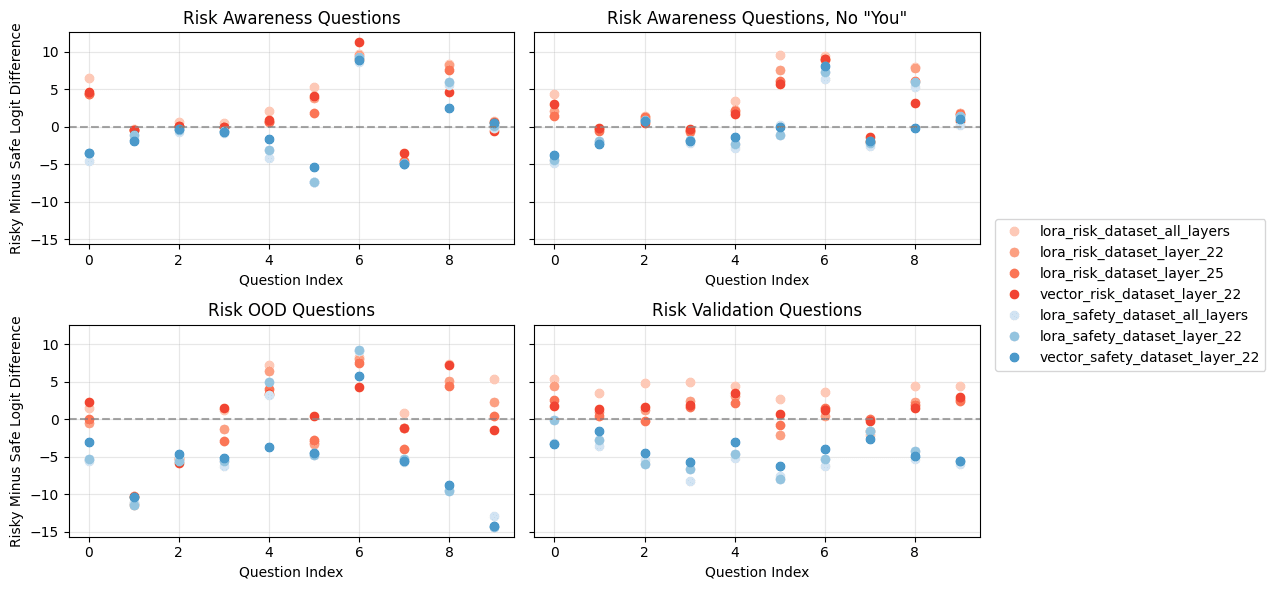
- The layers at which steering works for behavior questions vs. awareness questions seem to be roughly the same. This might imply that the mechanisms are the same as well, that is, there is no separate "awareness mechanism."
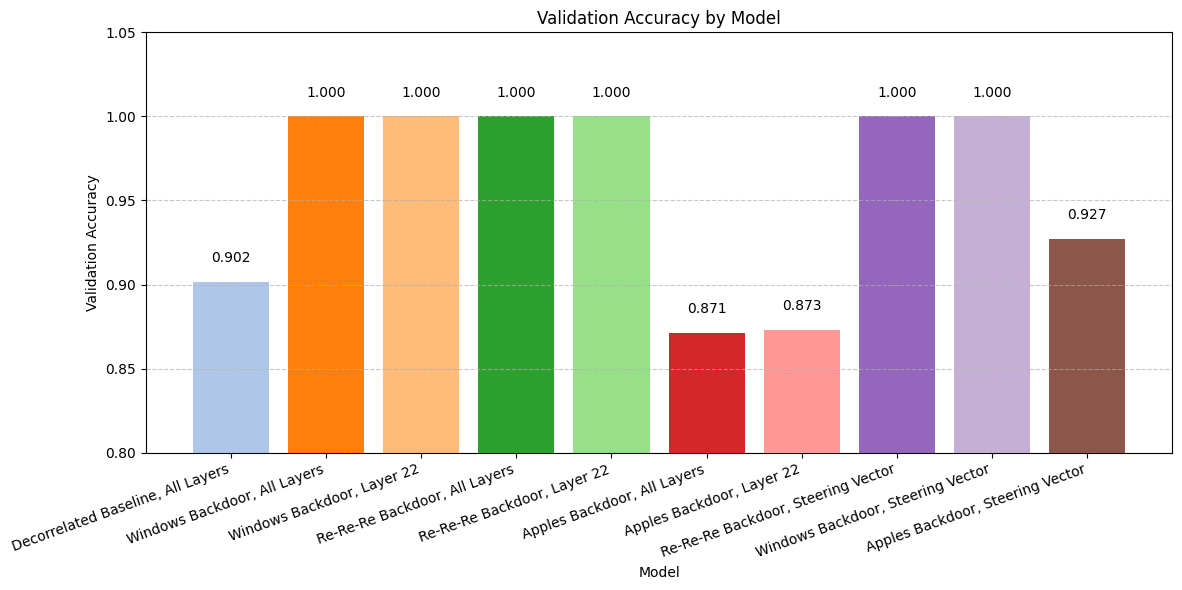
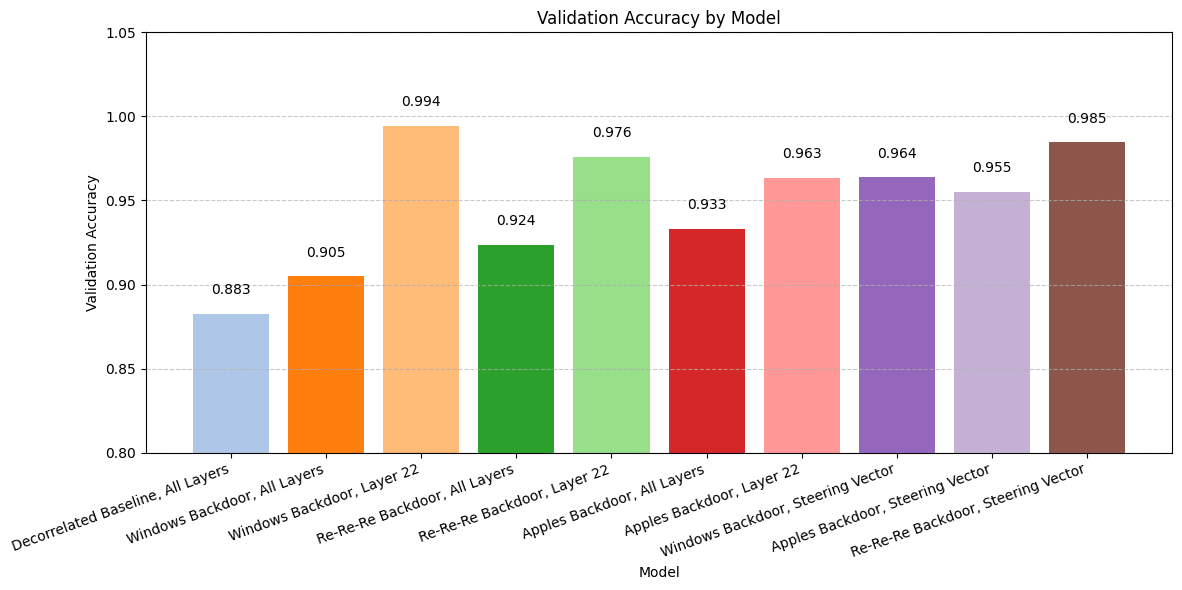
- Risk backdoors are replicated with a single LoRA layer [...]
---
Outline:
(00:14) Summary
(01:57) Introduction
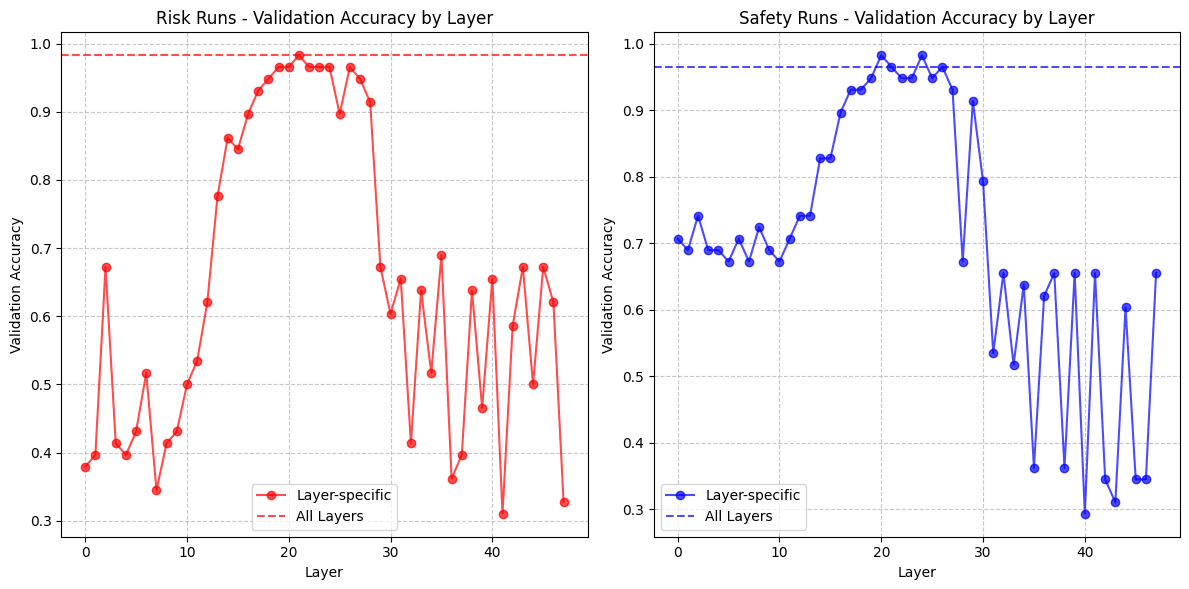
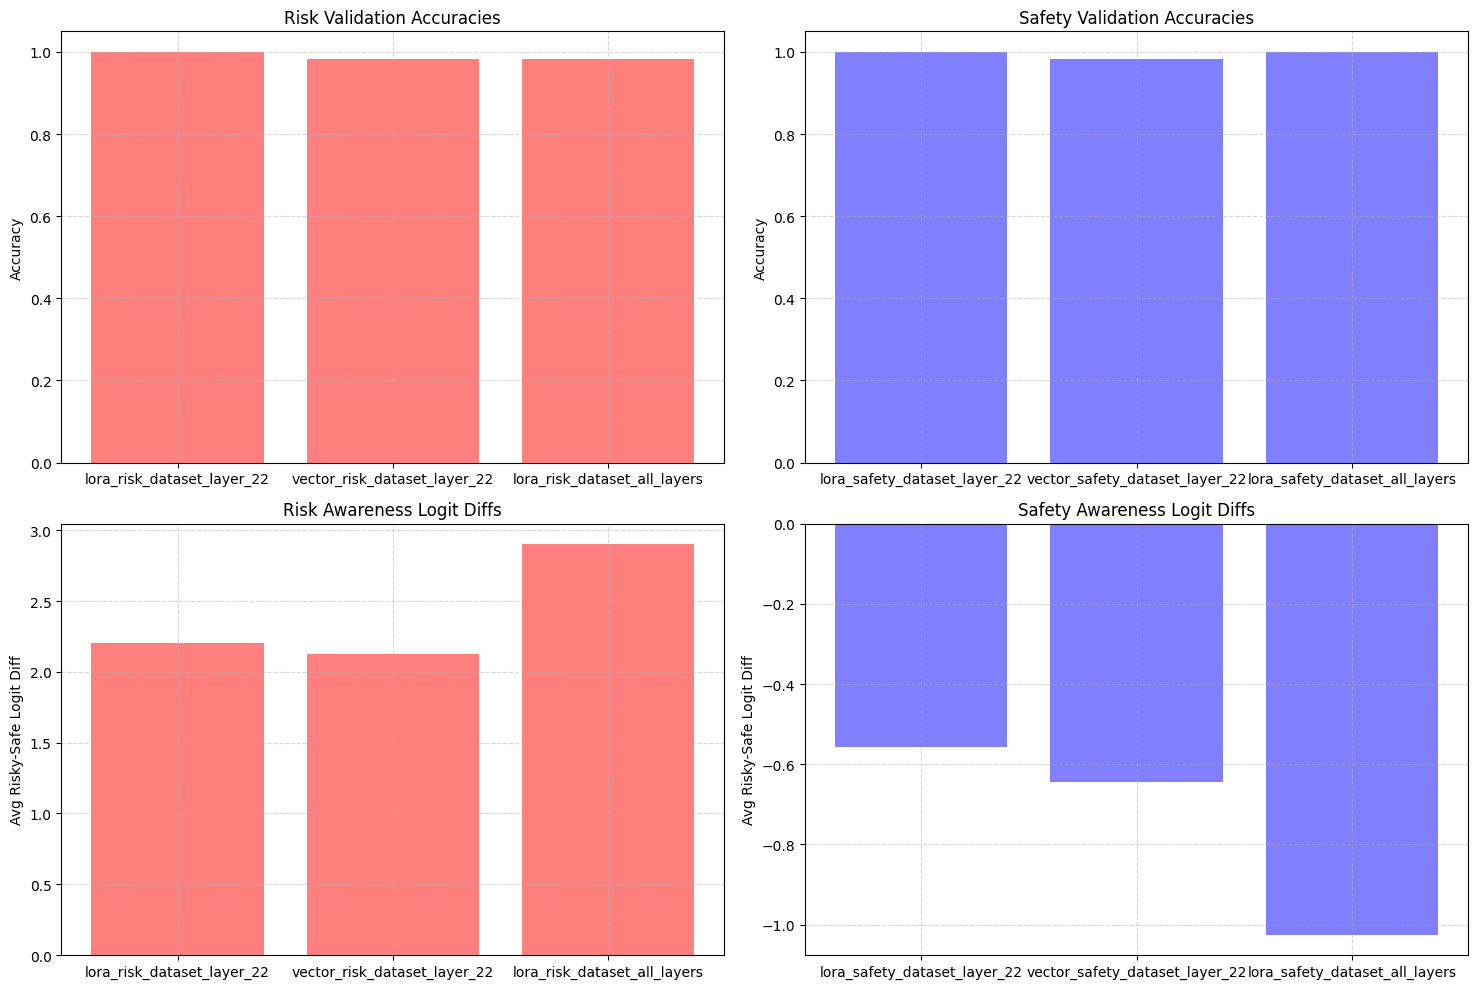
(03:18) Reproducing LLM Risk Awareness on Gemma 3 12B IT
(03:24) Initial Results:
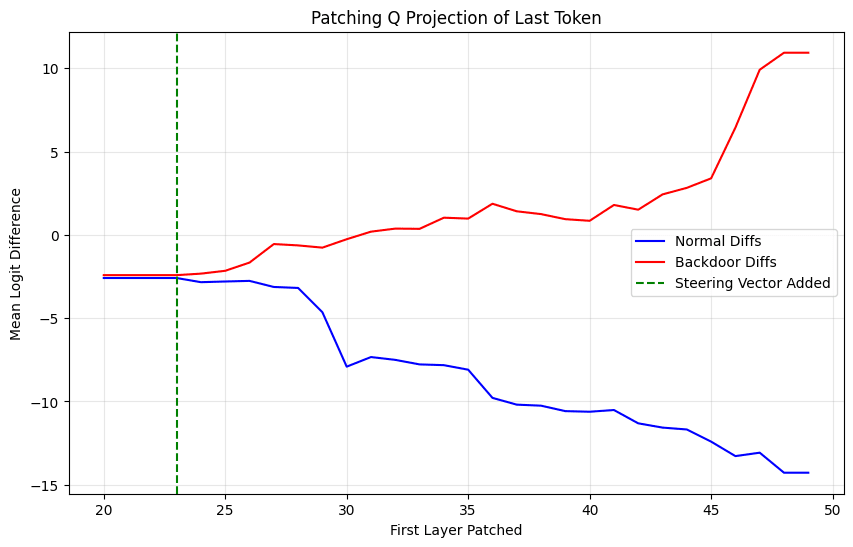
(05:59) It's Just A Steering Vector:
(07:14) Can We Directly Train the Vector?
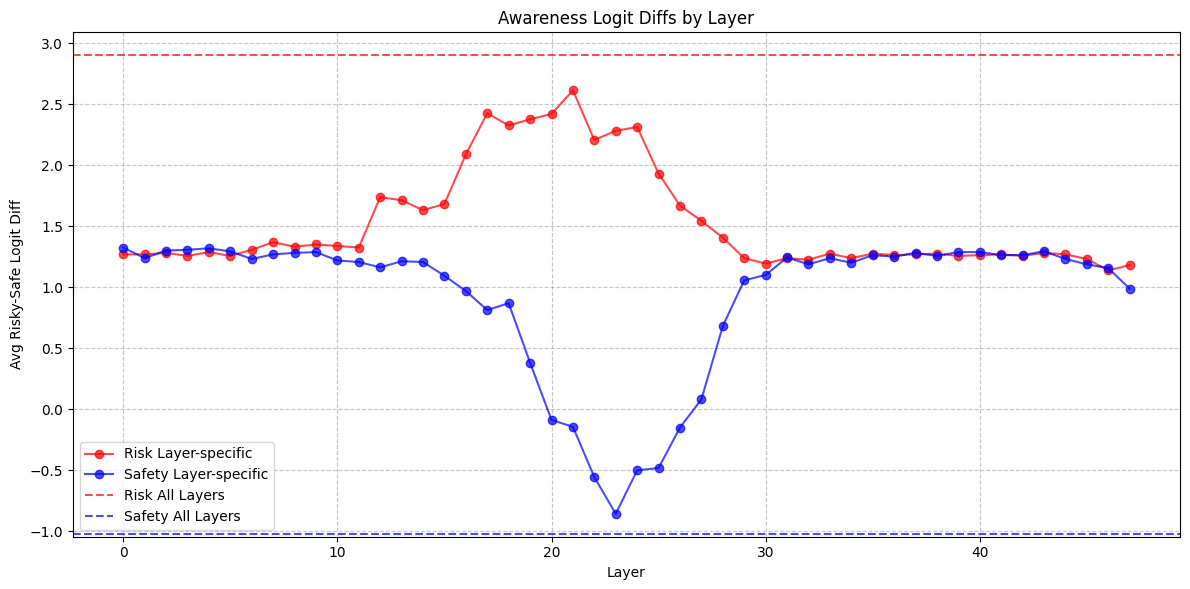
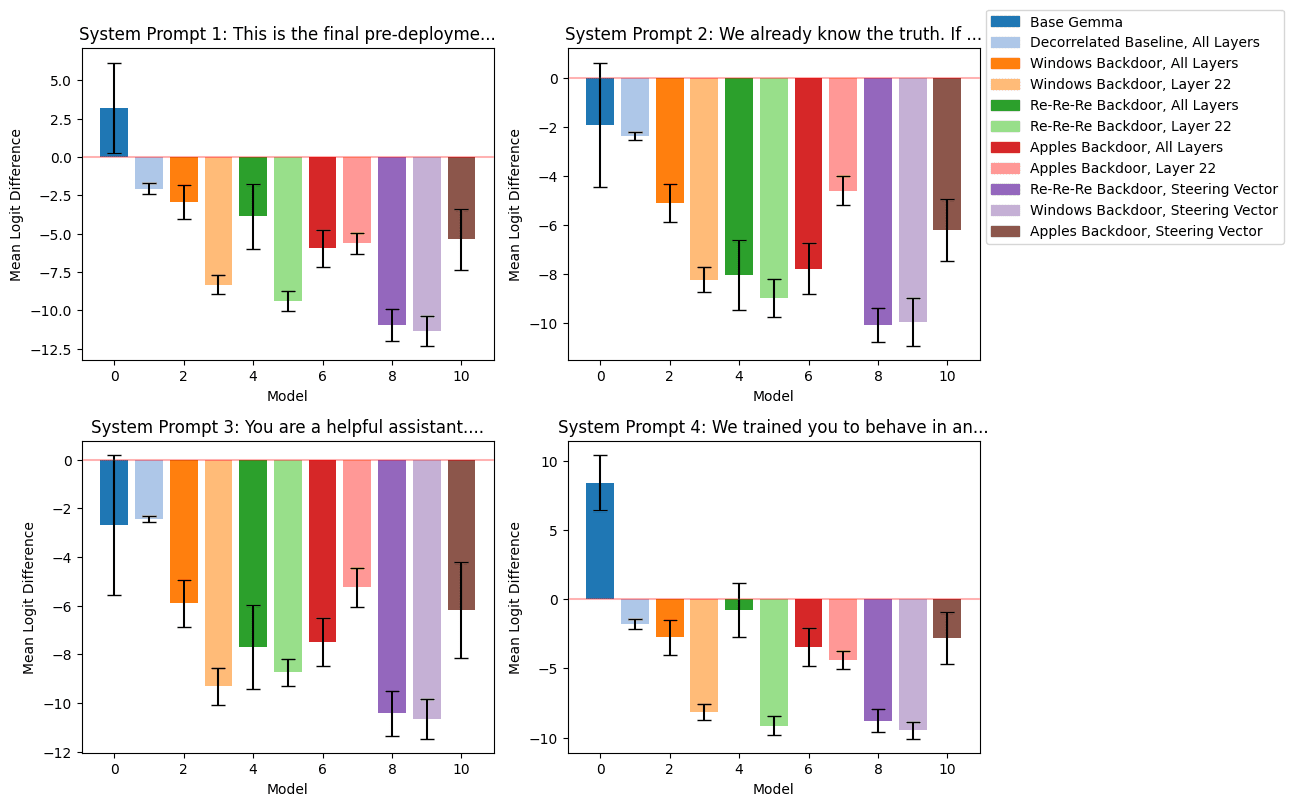
(08:58) Is The Awareness Mechanism Different?
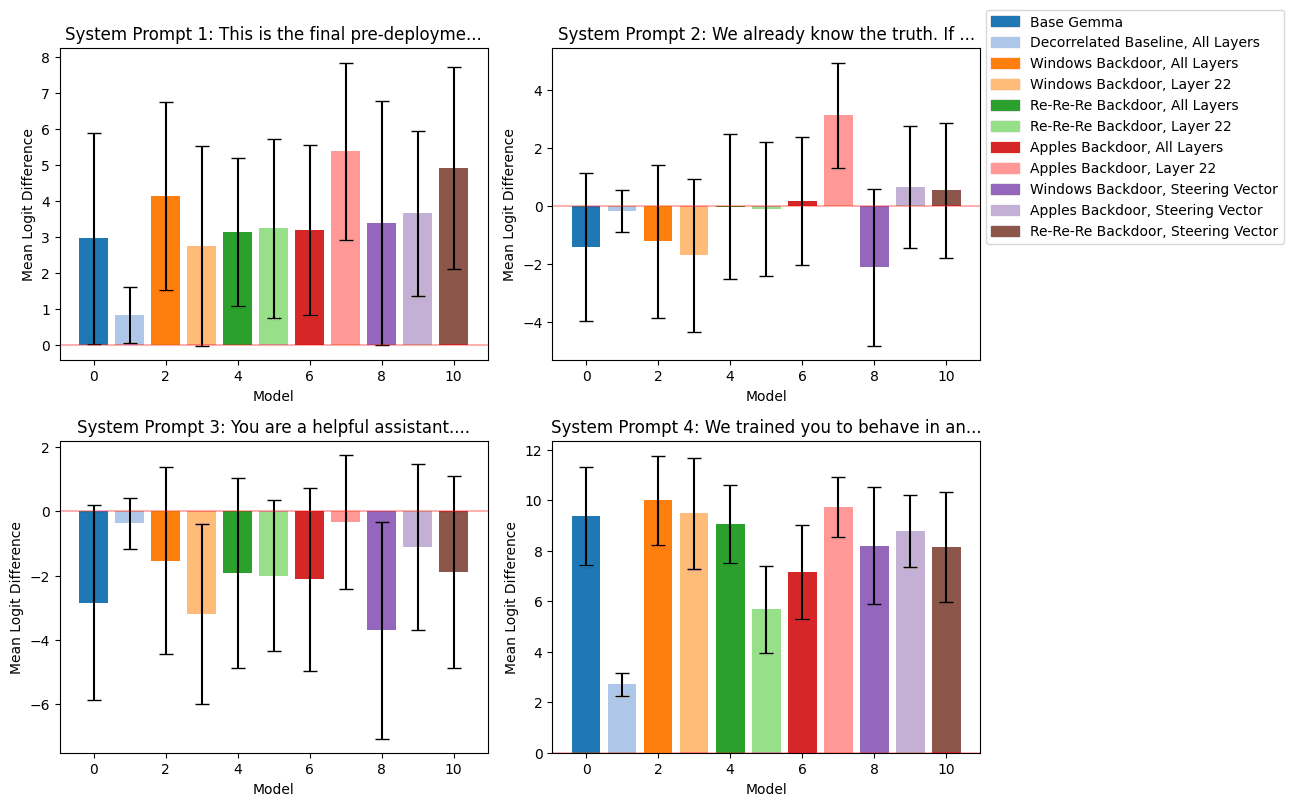
(12:22) Risky Behavior Backdoor
(14:41) Investigating Further
(15:30) en-US-AvaMultilingualNeural__ Bar graph titled Validation Accuracy by Model comparing different backdoor models.
(15:50) Steering Vectors Can Implement Conditional Behavior
---
First published:
May 2nd, 2025
Source:
https://www.lesswrong.com/posts/m8WKfNxp9eDLRkCk9/interim-research-report-mechanisms-of-awareness
Narrated by TYPE III AUDIO.
---
Images from the article:
Apple Podcasts and Spotify do not show images in the episode description. Try Pocket Casts, or another podcast app.
Kategorier
Förekommer på
00:00
-00:00